
Giftedness Meaning and Myth
For decades, advocates for gifted education have believed that society has a “love-hate” relationship with gifted students (J. Gallagher, 1988). The “love” in this equation represents the public’s appreciation for the benefits reaped from the inventions and insights of creative, productive individuals; the “hate” is the envy some feel towards others who seem to have an easier path to higher achievement and its rewards.
However, the belief in the society’s ambivalent attitude has taken root in the absence of substantial data that it actually exists. Although research reports the mixed feelings that some teachers and parents hold towards gifted students (McCoach & Siegle, 2007; Troxclair, 2013), assessment of public attitudes rarely extends beyond a few questions. In fact, there is little evidence indicating that the public understands what the word “gifted” means. Assessing public understanding is a crucial early step in any advocacy plan. A mismatch between an advocate’s assumptions about the public’s beliefs and the public’s actual beliefs is sure to lead to misdirected efforts. Specifically, efforts to gain support go awry if advocates and their audience do not agree on: (1) the meaning of important terms, (2) the conditions needing change, or (3) the potential impact of change–or the consequences of failing to change.
The way the public interprets the word “gifted,” both through literal definition and indirect interpretation, affects every conversation about policy and practice; therefore, the first set of items on the IEA-P was designed to discover how the public defines giftedness and related terms.
Respondents in the IEA-P believe that “gifted” students have an inherent capacity to learn more or faster than other students.
Public Definitions of “Gifted” and Related Terms: What Does “Gifted” Mean?
Merely asking the meaning of the word “gifted” does not adequately measure public understanding of the concept because so many avoid that specific word. An array of alternative terms act as workarounds for the word “gifted” based on the assumption that monikers like “high-ability” are more inclusive or palatable. This practice begs the question of whether the public actually has a negative response to the term “gifted,” and whether they think common alternates such as “advanced” or “highly- able” are synonymous with “gifted.” To answer these questions, IEA-P respondents answered the open-ended query, “When you think about ‘x’ students, what words, images, or types of students come to mind?” The eight terms included in this question included: (1) Gifted, (2) Gifted and Talented, (3) Genius, (4) Advanced Learner, (5) High-Potential, (6) High-Achieving, (7) High- Performing, and (8) Highly-Able [7] . The descriptors offered by respondents for each term were sorted into thematic categories according to common meaning. A single respondent could provide several descriptors, each coded into different categories, but individual descriptors were coded only once. The resulting global categories represented either: relevant descriptions of students who excel (i.e., intrinsic ability, quick learning, achievement, creativity), or (2) stereotypic descriptions of giftedness (i.e., affluent, nerd, socially awkward).
Past Public Polling About Gifted Education
The most consistent polling about public attitudes toward gifted education was comprised of one or two questions embedded into the annual Phi Delta Kappan/Gallup Poll of the Public’s Attitudes Towards Public Schools. The PDK/Gallup poll has gathered public opinion about a variety of public education issues every year since the mid-1970s. In the 1980s, the poll occasionally included a couple of questions about gifted education. Three times during the 1980s the PDK poll included a question asking the public whether funding for gifted education should increase, stay the same, or decrease. Each year the majority of respondents responded that funding should stay the same, although support for improving gifted education funding increased overall between 1982 and 1988, with a peak in support in 1985 (Gallup,1985; Gallup & Elam, 1982; Gallup & Elam, 1988). Only a small proportion of the public favored spending less on gifted students in any year. In a different question on the 1980 poll, 25% of the public selected gifted education as one of its top priorities for federal education spending (G. H. Gallup, 1980). The Gallup poll stopped asking the question about gifted education funding in the Phi Delta Kappan poll at the end of the 1980s and has only asked about gifted students once or twice since then.
In 1992, Gallup conducted a brief public opinion poll about gifted education with a random sample of 1000 members of the general public and an oversample of parents of gifted students (Larsen, Griffin, & Larsen, 1994). The primary focus on this poll was to determine the support for gifted education from the public in general as opposed to the support from parents of gifted students. Relevant results from that poll are integrated into the current report.
For most respondents, the terms “Gifted,” “Gifted and Talented,” “Genius,” or “Advanced Learner,” elicited words or images associated with intrinsic ability or an innate capacity to learn quickly (Table 1.1). Eighty- three percent of the descriptors offered for the word “Genius” related to intrinsic ability or rapid learning, as were 82% of the descriptors for “Gifted,” 73% for “Advanced,” and 67% for “Gifted and Talented.” Fewer than 25% of the words or images offered to describe the terms “Gifted,” “Gifted and Talented,” or “Genius” were related to school achievement, an indication that respondents did not immediately link giftedness with school success.
The responses also suggest that poll respondents distinguish between students who excel because of superior ability and students who excel because of hard work. Descriptors offered for prompts beginning with “High-x” or “Highly-x” were more varied, but in general they portrayed successful students with Guts, Resilience, Initiative and Tenacity (GRIT) (Duckworth, 2016): they are described as hardworking, motivated, and determined. This was true even when “High-” was paired with “Potential.” Fifty-five percent of descriptors offered for students who were “High-Achieving,” “High- Potential,” or “High-Performing” were associated with achievement, as were 40% of descriptors for the term “Highly-Able,” evoking Renzulli’s definition of “schoolhouse gifted” (Renzulli, 1982).
Percentage of Responses to: “When You Think About ‘x’ Students, What Words, Images, or Types of Students Come to Mind?” (Q23-30)
| Relevant Descriptors | Stereotypic Descriptors | ||||||||
|
Split a |
Intrinsic Ability |
Fast Learner |
School Achiever |
Creative/ Artistic |
|
Affluent |
Awkward |
Nerds |
|
|
Term |
sample |
% |
% |
% |
% |
|
% |
% |
% |
|
Genius |
E |
47 |
36 |
17 |
6 |
|
4 |
4 |
3 |
|
Gifted and Talented |
D |
42 |
25 |
20 |
14 |
|
6 |
2 |
3 |
|
Gifted |
C |
38 |
44 |
18 |
8 |
|
5 |
2 |
3 |
|
Advanced Learners |
E |
22 |
51 |
23 |
1 |
|
2 |
1 |
1 |
|
High-Achieving |
D |
25 |
12 |
55 |
1 |
|
5 |
1 |
3 |
|
High-Potential |
C |
20 |
9 |
55 |
1 |
|
2 |
0 |
4 |
|
Highly-Able |
C |
21 |
15 |
40 |
1 |
|
5 |
2 |
1 |
|
High-Performing |
E |
20 |
14 |
55 |
2 |
|
4 |
0 |
1 |
Note. Relevant Descriptors: Intrinsic Ability = smart, above average, high IQ, gifted/talented, genius, leaders. Fast Learner = advanced learner, ahead of peers, skips grades, fast learner. School Achiever = hard-working, independent, focused, competitive, high- or over- achiever, good grades. Creative = creative, artistic. Stereotypic Descriptors: Affluent = rich, wealthy, well off. Awkward = awkward, social problems. Nerd = glasses, nerd.
a Split samples C and D: n= 471 each, split sample E: n = 472. See Appendix B table B3 for standard error of measure.
Across the board, the terms elicited very few words or images associated with creativity. Descriptors related to creativity were offered most often for the term “Gifted and Talented” (14%), followed by “Gifted” (8%), and “Genius” (6%). Terms beginning with “High-” almost never evoked words or images associated with creativity.
Respondents offered few stereotypic descriptions and no words or images that suggested dislike for children with advanced ability (Table 1.1). Only 5-6% of respondents used descriptors associated with wealth, and these were primarily associated with the terms “Gifted,” “High-Achieving,” “Highly- Able,” and “Gifted and Talented.” “Genius” students were most likely to be described as awkward (4%), and students with “High-Potential” were most likely to be described as nerds (4%). None of the eight terms elicited references to underachievement or failure to fulfill potential. Descriptors associated with different personality attributes were also notably absent, aside from those related to GRIT; there were no suggestions of curiosity, inquisitiveness, intensity, or intuition. In their descriptions of giftedness and ability, respondents generally kept a narrow focus on the capacity to learn.
Public Beliefs about Giftedness: Assessing Myth and Reality
Support for gifted programs often hinges on accurate public understanding of more than just a definition; society must also realize that gifted students come from all racial and economic groups, that giftedness occurs on an ability continuum, and that all gifted students require specialized services to work towards their potential. Garnering support for gifted students is more difficult if the public holds mistaken beliefs, or “myths,” about gifted children (e.g., gifted students will be fine without special programs). Identifying what the public does and does not believe about gifted students helps determine where to target advocacy efforts.
Percentage of Respondents who Agree or Disagree: “Gifted Students are Rare—Comprising a Very Small Percentage of the Total Student Population.” (Q37R6)
| Total | Degree of Agreement | ||||||||
|
Group |
Weighted n |
Agree % |
Disagree % |
Strongly Agree % |
Somewhat Agree % |
Somewhat Disagree % |
Strongly Disagree % |
||
|
Education Influencers |
|||||||||
|
Opinion Elites |
42 |
77 |
23 |
28 |
49 |
22 |
1 |
||
|
Parents |
424 |
72 |
28 |
21 |
51 |
25 |
3 |
||
|
Race/Ethnicity |
|||||||||
|
Black |
176 |
74 |
26 |
27 |
47 |
22 |
4 |
||
|
Hispanic |
156 |
80 |
20 |
26 |
53 |
16 |
4 |
||
|
White |
1004 |
73 |
27 |
19 |
54 |
25 |
2 |
||
| Race/Ethnicity x Income | |||||||||
|
Black |
Below 50K |
96 |
75 |
25 |
22 |
53 |
22 |
3 |
|
|
Black |
Above 50K |
74 |
71 |
29 |
33 |
39 |
24 |
4 |
|
|
Hispanic |
Below 50K |
75 |
83 |
17 |
32 |
50 |
15 |
3 |
|
|
Hispanic |
Above 50K |
73 |
74 |
26 |
22 |
52 |
19 |
7 |
|
|
White |
Below 50K |
395 |
76 |
24 |
18 |
59 |
20 |
3 |
|
|
White |
Above 50K |
580 |
71 |
29 |
20 |
51 |
28 |
1 |
|
| Total | 1414 | 74 | 26 | 20 | 54 | 23 | 3 | ||
Notes. At the 95% confidence level the standard error of measure for the entire sample is ±2.51%. It is ±6.21% among Opinion Elites, ±3.73% among Parents, ±6.03% among Blacks, ±5.81% among Hispanics, and ±3.33 among Whites. Race/Ethnicity does not include respondents who selected more than one race. Race/Ethnicity x Income does not include respondents who selected “Prefer Not to Indicate.”
The poll assessed whether the public could distinguish between accurate and inaccurate claims made about gifted students. Many of the statements presented in these questions represent mistaken, but presumably widely held, convictions about giftedness, including that: (1) giftedness is common, (2) gifted students do not need special services, (3) gifted students are always at the top of their class, and (4) gifted students are wealthy. Respondents also answered questions asking whether they thought gifted students receive more resources than either average students or students level as students with learning disabilities. Answers offered by IEA-P respondents, summarized in Tables 1.2 to 1.5 [8] , indicate that Americans are capable of distinguishing between myth and reality regarding the nature of giftedness.
Is everyone gifted, or are gifted children rare? The question of whether respondents believed all students are gifted was addressed indirectly by asking if they agreed that gifted students comprised a small subset of the student population. Three of every four respondents (74%) agreed that with learning disabilities, and whether they thought if gifted students should receive resources at the same gifted students are rare (Figure 1.1). Only 3% of the respondent group strongly disagreed with the statement that gifted children are rare (Table 1.2).
Education Influencers. Over 70% of Opinion Elites and Parents agreed that gifted students are rare, with Opinion Elites somewhat more inclined to strongly agree (28% Opinion Elites, 21% Parents).
Racial/Ethnic Groups. Over 70% of each racial/ethnic group agreed that gifted students are rare, led by 80% of Hispanics. Close to 20% of each subgroup strongly agreed, led by one-third of higher-income Black and lower-income Hispanic respondents (33% and 32%, respectively).
Are gifted kids so smart they don’t need special programs? A majority of the American public understands that gifted students need specialized services to fulfill their potential (Figure 1.2). Sixty- eight percent disagreed with the statement “Gifted students are so smart, they do just fine without special programs.” Between 60-70% of respondents disagreed with the statement regardless of income or race/ethnicity (Table 1.3).
Percentage of Respondents Who Agree or Disagree That, “Because Gifted Kids are so Smart, They do Just Fine With or Without Special Programs Designed for Them.” (Q37R2)
| Total | Degree of Agreement | ||||||||
|
Group |
Weighted n |
Agree % |
Disagree % |
Strongly Agree % |
Somewhat Agree % |
Somewhat Disagree % |
Strongly Disagree % |
||
|
Education Influencers |
|||||||||
|
Opinion Elites |
42 |
38 |
62 |
12 |
26 |
34 |
28 |
||
|
Parents |
424 |
29 |
71 |
8 |
21 |
48 |
23 |
||
|
Race/Ethnicity |
|||||||||
|
Black |
176 |
38 |
62 |
7 |
30 |
40 |
22 |
||
|
Hispanic |
156 |
33 |
67 |
8 |
25 |
42 |
25 |
||
|
White |
1004 |
30 |
70 |
4 |
25 |
48 |
22 |
||
| Race/Ethnicity x Income | |||||||||
|
Black |
Below $50K |
96 |
39 |
61 |
6 |
33 |
42 |
19 |
|
|
Black |
Above $50K |
74 |
33 |
67 |
8 |
25 |
39 |
28 |
|
|
Hispanic |
Below $50K |
75 |
34 |
66 |
12 |
21 |
47 |
19 |
|
|
Hispanic |
Above $50K |
73 |
25 |
75 |
4 |
21 |
41 |
34 |
|
|
White |
Below $50K |
395 |
33 |
67 |
5 |
27 |
46 |
22 |
|
|
White |
Above $50K |
580 |
27 |
73 |
4 |
24 |
50 |
23 |
|
| Total | 1414 | 32 | 68 | 5 | 26 | 46 | 22 | ||
Notes. For standard error of measure see Appendix B, Table B3. At the 95% confidence level the standard error of measure for the entire sample is ±2.51%. It is ±6.21% among Opinion Elites, ±3.73% among Parents, ±6.03% among Blacks, ±5.81% among Hispanics, and ±3.33 among Whites. Race/Ethnicity does not include respondents who selected more than one race. Race/Ethnicity x Income does not include respondents who selected “Prefer Not to Indicate.”
Do You Agree or Disagree: Gifted Students are Rare?
Figure 1.1. Percentage of respondents who agreed or disagreed that “Gifted students are rare—comprising a very small percentage of the total student population.”
Do You Agree or Disagree: Gifted Students Are So Smart, They Do Just Fine without Special Programs?
Figure 1.2. Percentage of respondents who agreed or disagreed with “Gifted students are so smart, they do just fine without special programs.”
Education Influencers. Only 29% of Parents and 38% of Opinion Elites agreed that gifted students did not need special programs. Of those who agreed that special programs were not necessary, only 12% of Opinion Elites and 8% of Parents strongly agreed.
Racial/Ethnic Groups. Between 30-40% of respondents agreed with the statement that gifted students do not need special programs regardless of income or racial/ethnic group. The number of respondents from each group who “strongly disagreed,” was at least three times higher than the number who “strongly agreed.”
The American public has a clear understanding that gifted students come from all income groups.
Are gifted students typically at the top of their class? When asked to describe gifted students, IEA-P respondents did not volunteer words or images associated with achievement. However, when asked directly if gifted students were generally at the top of their class, a slight majority (55%) thought they were (Figure 1.3, Table 1.4).
Education Influencers. Parents were nearly equally split between those who agreed (52%) or disagreed (48%) that gifted students were at the top of their class. Opinion Elites were among the least likely to agree that gifted students were always at the top of their class; 36% agreed with the statement, and only 13% strongly agreed.
Racial/Ethnic Groups. Black respondents were most likely to agree overall (67%) and to strongly agree (22%) that gifted students were always at the top of their class. Just over half of White respondents agreed overall (52%), and they were least likely to strongly agree (13%). Among racial/ethnic x income groups, lower-income Blacks were most likely to agree overall (72%), followed by higher-income Blacks (60%).
Do gifted students generally come from well-off families? The American public has a clear understanding that gifted students come from all income groups (Figure 1.4). Of the IEA-P respondents, 71% rejected the notion that gifted students come from well-off families. More than one in four (29%) strongly disagreed that gifted students were affluent (Table 1.5), while only a few strongly agreed (7%).
Education Influencers. Of the Opinion Elites, 39% agreed that gifted students generally come from well- off families and 11% strongly agreed. The number of Opinion Elites agreeing with the statement was substantially higher than most other groups including Parents, only 25% of whom agreed overall, and only 6% of whom strongly agreed.
Percent of Respondents who Agree or Disagree that, “Gifted Students are Always at the Top of Their Class Academically.” (Q37R1)
| Total | Degree of Agreement | ||||||||
|
Group |
Weighted n |
Agree % |
Disagree % |
Strongly Agree % |
Somewhat Agree % |
Somewhat Disagree % |
Strongly Disagree % |
||
|
Education Influencers |
|||||||||
|
Opinion Elites |
42 |
49 |
51 |
13 |
36 |
41 |
10 |
||
|
Parents |
424 |
52 |
48 |
15 |
37 |
38 |
9 |
||
|
Race/Ethnicity |
|||||||||
|
Black |
176 |
67 |
33 |
22 |
45 |
25 |
8 |
||
|
Hispanic |
156 |
56 |
44 |
18 |
39 |
31 |
13 |
||
|
White |
1004 |
52 |
48 |
13 |
39 |
38 |
10 |
||
| Race/Ethnicity x Income | |||||||||
|
Black |
Below $50K |
96 |
72 |
28 |
22 |
50 |
22 |
6 |
|
|
Black |
Above $50K |
74 |
60 |
40 |
21 |
38 |
31 |
10 |
|
|
Hispanic |
Below $50K |
75 |
56 |
44 |
23 |
32 |
30 |
14 |
|
|
Hispanic |
Above $50K |
73 |
53 |
47 |
14 |
39 |
36 |
11 |
|
|
White |
Below $50K |
395 |
57 |
43 |
15 |
42 |
34 |
9 |
|
|
White |
Above $50K |
580 |
49 |
51 |
12 |
37 |
40 |
11 |
|
| Total | 1414 | 55 | 45 | 15 | 40 | 35 | 10 | ||
Notes. At the 95% confidence level the standard error of measure for the entire sample is ±2.51%. It is ±6.21% among Opinion Elites, ±3.73% among Parents, ±6.03% among Blacks, ±5.81% among Hispanics, and ±3.33 among Whites. Race/Ethnicity does not include respondents who selected more than one race. Race/Ethnicity x Income does not include respondents who selected “Prefer Not to Indicate.”
Racial/Ethnic Groups. Among the three racial/ethnic groups, Blacks were least likely to agree that gifted students are from well-off families (24%). While Hispanic respondents were more likely than White or Black respondents to believe that gifted students come from well-off families, a majority (68%) thought they were not, and 36% “strongly disagreed.” Lower- income respondents within each racial/ethnic group were more likely to think that gifted students were affluent, compared to their higher-income counterparts. The greatest within group discrepancy was between higher- and lower-income Hispanics (38% and 20% who agree, respectively).
Do You Agree or Disagree: Gifted Students Are Always At The Top Of Their Class Academically?
Figure 1.3. Percentage of respondents who agreed or disagreed with “Gifted students are always at the top of their class academically.”
Do You Agree or Disagree: Gifted Students Generally Come From Well-Off Families?
Figure 1.4. Percentage of respondents who agreed or disagreed that “Gifted students generally come from well- off families.”
Do gifted kids need just as much funding and support as students with learning disabilities? The American public believes the gifted students need funding and support at levels equal to students with learning disabilities. Nearly three of every four respondents agreed with this statement (73%), and 29% were in strong agreement (Figure 1.5).
Education Influencers. Seventy-five percent of Opinion Elites agreed that gifted students should receive funding and support equivalent to students with learning disabilities, with a nearly even split between those who strongly agree (36%) and somewhat agree (38%). A slightly higher proportion of Parents (79%) agreed that gifted students and students with learning disabilities should receive similar levels of funding. The proportion of Parents who strongly agreed was similar to the Opinion Elites (35%).
Racial/Ethnic Groups. Among racial/ethnic groups, Hispanics were most likely to agree that gifted students need funding and support similar to that of students with learning disabilities (84%), followed by Blacks (76%), and Whites (70%). Black respondents were most likely to strongly agree (39% Black, 31% Hispanic, 27% White). Of higher-income Black respondents, 42% strongly agreed that gifted students needed as much funding and support as students with learning disabilities, compared to only 29% of higher-income Hispanic or White respondents (Table 1.6).
Do You Agree or Disagree: Gifted Kids Need Just as Much Funding And Support as Students With Learning Disabilities?
Figure 1.5. Percentage of respondents who agreed or disagreed that “Gifted kids need just as much funding and support as students with learning disabilities.”
Percentage of Respondents who Agree or Disagree that, “Gifted Students Generally Come from Well-off Families.” (Q37R3)
| Total | Degree of Agreement | ||||||||
|
Group |
Weighted n |
Agree % |
Disagree % |
Strongly Agree % |
Somewhat Agree % |
Somewhat Disagree % |
Strongly Disagree % |
||
|
Education Influencers |
|||||||||
|
Opinion Elites |
42 |
39 |
61 |
11 |
28 |
35 |
26 |
||
|
Parents |
424 |
25 |
75 |
6 |
19 |
45 |
30 |
||
|
Race/Ethnicity |
|||||||||
|
Black |
176 |
24 |
76 |
8 |
16 |
37 |
39 |
||
|
Hispanic |
156 |
32 |
68 |
7 |
26 |
32 |
36 |
||
|
White |
1004 |
28 |
72 |
7 |
22 |
47 |
25 |
||
| Race/Ethnicity x Income | |||||||||
|
Black |
Below $50K |
96 |
25 |
75 |
7 |
18 |
44 |
31 |
|
|
Black |
Above $50K |
74 |
21 |
79 |
8 |
13 |
28 |
51 |
|
|
Hispanic |
Below $50K |
75 |
38 |
62 |
9 |
29 |
33 |
29 |
|
|
Hispanic |
Above $50K |
73 |
20 |
80 |
5 |
16 |
34 |
46 |
|
|
White |
Below $50K |
395 |
29 |
71 |
9 |
20 |
44 |
27 |
|
|
White |
Above $50K |
580 |
27 |
73 |
5 |
22 |
49 |
24 |
|
| Total | 1414 | 29 | 71 | 7 | 22 | 43 | 28 | ||
Notes. At the 95% confidence level the standard error of measure for the entire sample is ±2.51%. It is ±6.21% among Opinion Elites, ±3.73% among Parents, ±6.03% among Blacks, ±5.81% among Hispanics, and ±3.33 among Whites. Race/Ethnicity does not include respondents who selected more than one race. Race/Ethnicity x Income does not include respondents who selected “Prefer Not to Indicate.”
Education Influencers. Opinion Elites are nearly equally likely to think that average students and gifted students received more resources (33% average, 31% gifted). Parents were slightly more likely to think average students received more resources (36% average, 29% gifted).
Racial/Ethnic Groups. Over one-third of each racial/ ethnic group believed that gifted and average students received similar levels of resources; however, White respondents were more likely than Black or Hispanic respondents to think that average students received more resources than gifted students (34% White, 29% Hispanic, 24% Black). Black respondents were most likely to think that gifted students received more resources than average students (43%), followed by Hispanics (36%) and Whites (28%). In each racial/ethnic group, lower-income respondents were more likely than higher-income respondents to think that gifted students receive more resources than average students.
Percentage of Respondents who Agree or Disagree that, “Gifted Kids Need Just as Much Funding and Support as Students with Learning Disabilities.” (Q37R5)
| Total | Degree of Agreement | ||||||||
|
Group |
Weighted n |
Agree % |
Disagree % |
Strongly Agree % |
Somewhat Agree % |
Somewhat Disagree % |
Strongly Disagree % |
||
|
Education Influencers |
|||||||||
|
Opinion Elites |
42 |
74 |
26 |
36 |
38 |
23 |
4 |
||
|
Parents |
424 |
79 |
21 |
35 |
44 |
17 |
4 |
||
|
Race/Ethnicity |
|||||||||
|
Black |
176 |
76 |
24 |
39 |
37 |
19 |
5 |
||
|
Hispanic |
156 |
84 |
16 |
31 |
53 |
11 |
5 |
||
|
White |
1004 |
70 |
30 |
27 |
43 |
25 |
5 |
||
| Race/Ethnicity x Income | |||||||||
|
Black |
Below $50K |
96 |
72 |
28 |
37 |
35 |
20 |
8 |
|
|
Black |
Above $50K |
74 |
81 |
19 |
42 |
38 |
17 |
2 |
|
|
Hispanic |
Below $50K |
75 |
80 |
20 |
35 |
45 |
10 |
10 |
|
|
Hispanic |
Above $50K |
73 |
85 |
15 |
29 |
57 |
13 |
1 |
|
|
White |
Below $50K |
395 |
70 |
30 |
25 |
45 |
25 |
5 |
|
|
White |
Above $50K |
580 |
70 |
30 |
29 |
41 |
26 |
4 |
|
| Total | 1414 | 73 | 27 | 29 | 43 | 23 | 5 | ||
Notes. At the 95% confidence level the standard error of measure for the entire sample is ±2.51%. It is ±6.21% among Opinion Elites, ±3.73% among Parents, ±6.03% among Blacks, ±5.81% among Hispanics, and ±3.33 among Whites. Race/Ethnicity does not include respondents who selected more than one race. Race/Ethnicity x Income does not include respondents who selected “Prefer Not to Indicate.”
Do gifted students receive more resources than learning-disabled students? For the most part, the public believed that students with learning disabilities received more resources than gifted students (Figure 1.7). Fifty-eight percent of the overall sample thought students with learning disabilities received more resources, while 23% believed gifted students received more, and 19% believed the two groups received the same amount (Table 1.7).
Education Influencers. Opinion Elites and Parents were equally likely to think that students with learning disabilities received more resources than gifted students, with 62% of each group believing that students with learning disabilities receive more. These two groups were the least likely to think that gifted students receive more resources, with 19% of Opinion Elites and 17% of Parents believing gifted students receive more resources than students with learning disabilities.
Racial/Ethnic Groups. Among the three racial/ethnic groups, White respondents were the most likely to say that students with learning disabilities receive more resources (63%). Black respondents were least likely to say that students with learning disabilities received more resources than gifted students, and most likely to report that gifted students received more resources than students with learning disabilities; 34% of Black respondents answered that gifted students receive more resources compared to 27% of Hispanics and 20% of White respondents.
Who Receives More Resources, Gifted or Average Students?
Figure 1.6. Percentage of responses to “Who receives more resources, gifted, or average students?”
Who Receives More Resources, Gifted or Students with Learning Disabilities?
Figure 1.7. Percentage of responses to “Who receives more resources, gifted, or learning-disabled students?”
Then & Now
The 1982 Phi Delta Kappan/Gallup Poll of the Public’s Attitudes Toward Public Schools included questions asking respondents whether they thought special funding for students with “learning problems” and students who are gifted and talented should increase. Among all poll respondents, 42% supported increases in funding for students with “learning problems” but only 19% supported a funding increase for gifted
and talented students (Gallup & Elam, 1982). These finding were replicated in the 1992 Gallup poll, when 45% of the public supported increases in funds for students with learning problems and 16% supported increases in support for gifted and talented students (Larsen, Griffin, & Larsen, 1994).
In 2016, 73% of IEA-P respondents agreed that gifted students require just as much funding and support as students with learning disabilities.
Percentage of Responses: “Under the Current System, Who Would You Say Tends to get More Resources, Gifted Students or (Average/Learning Disabled) Students?” (Q38-39)
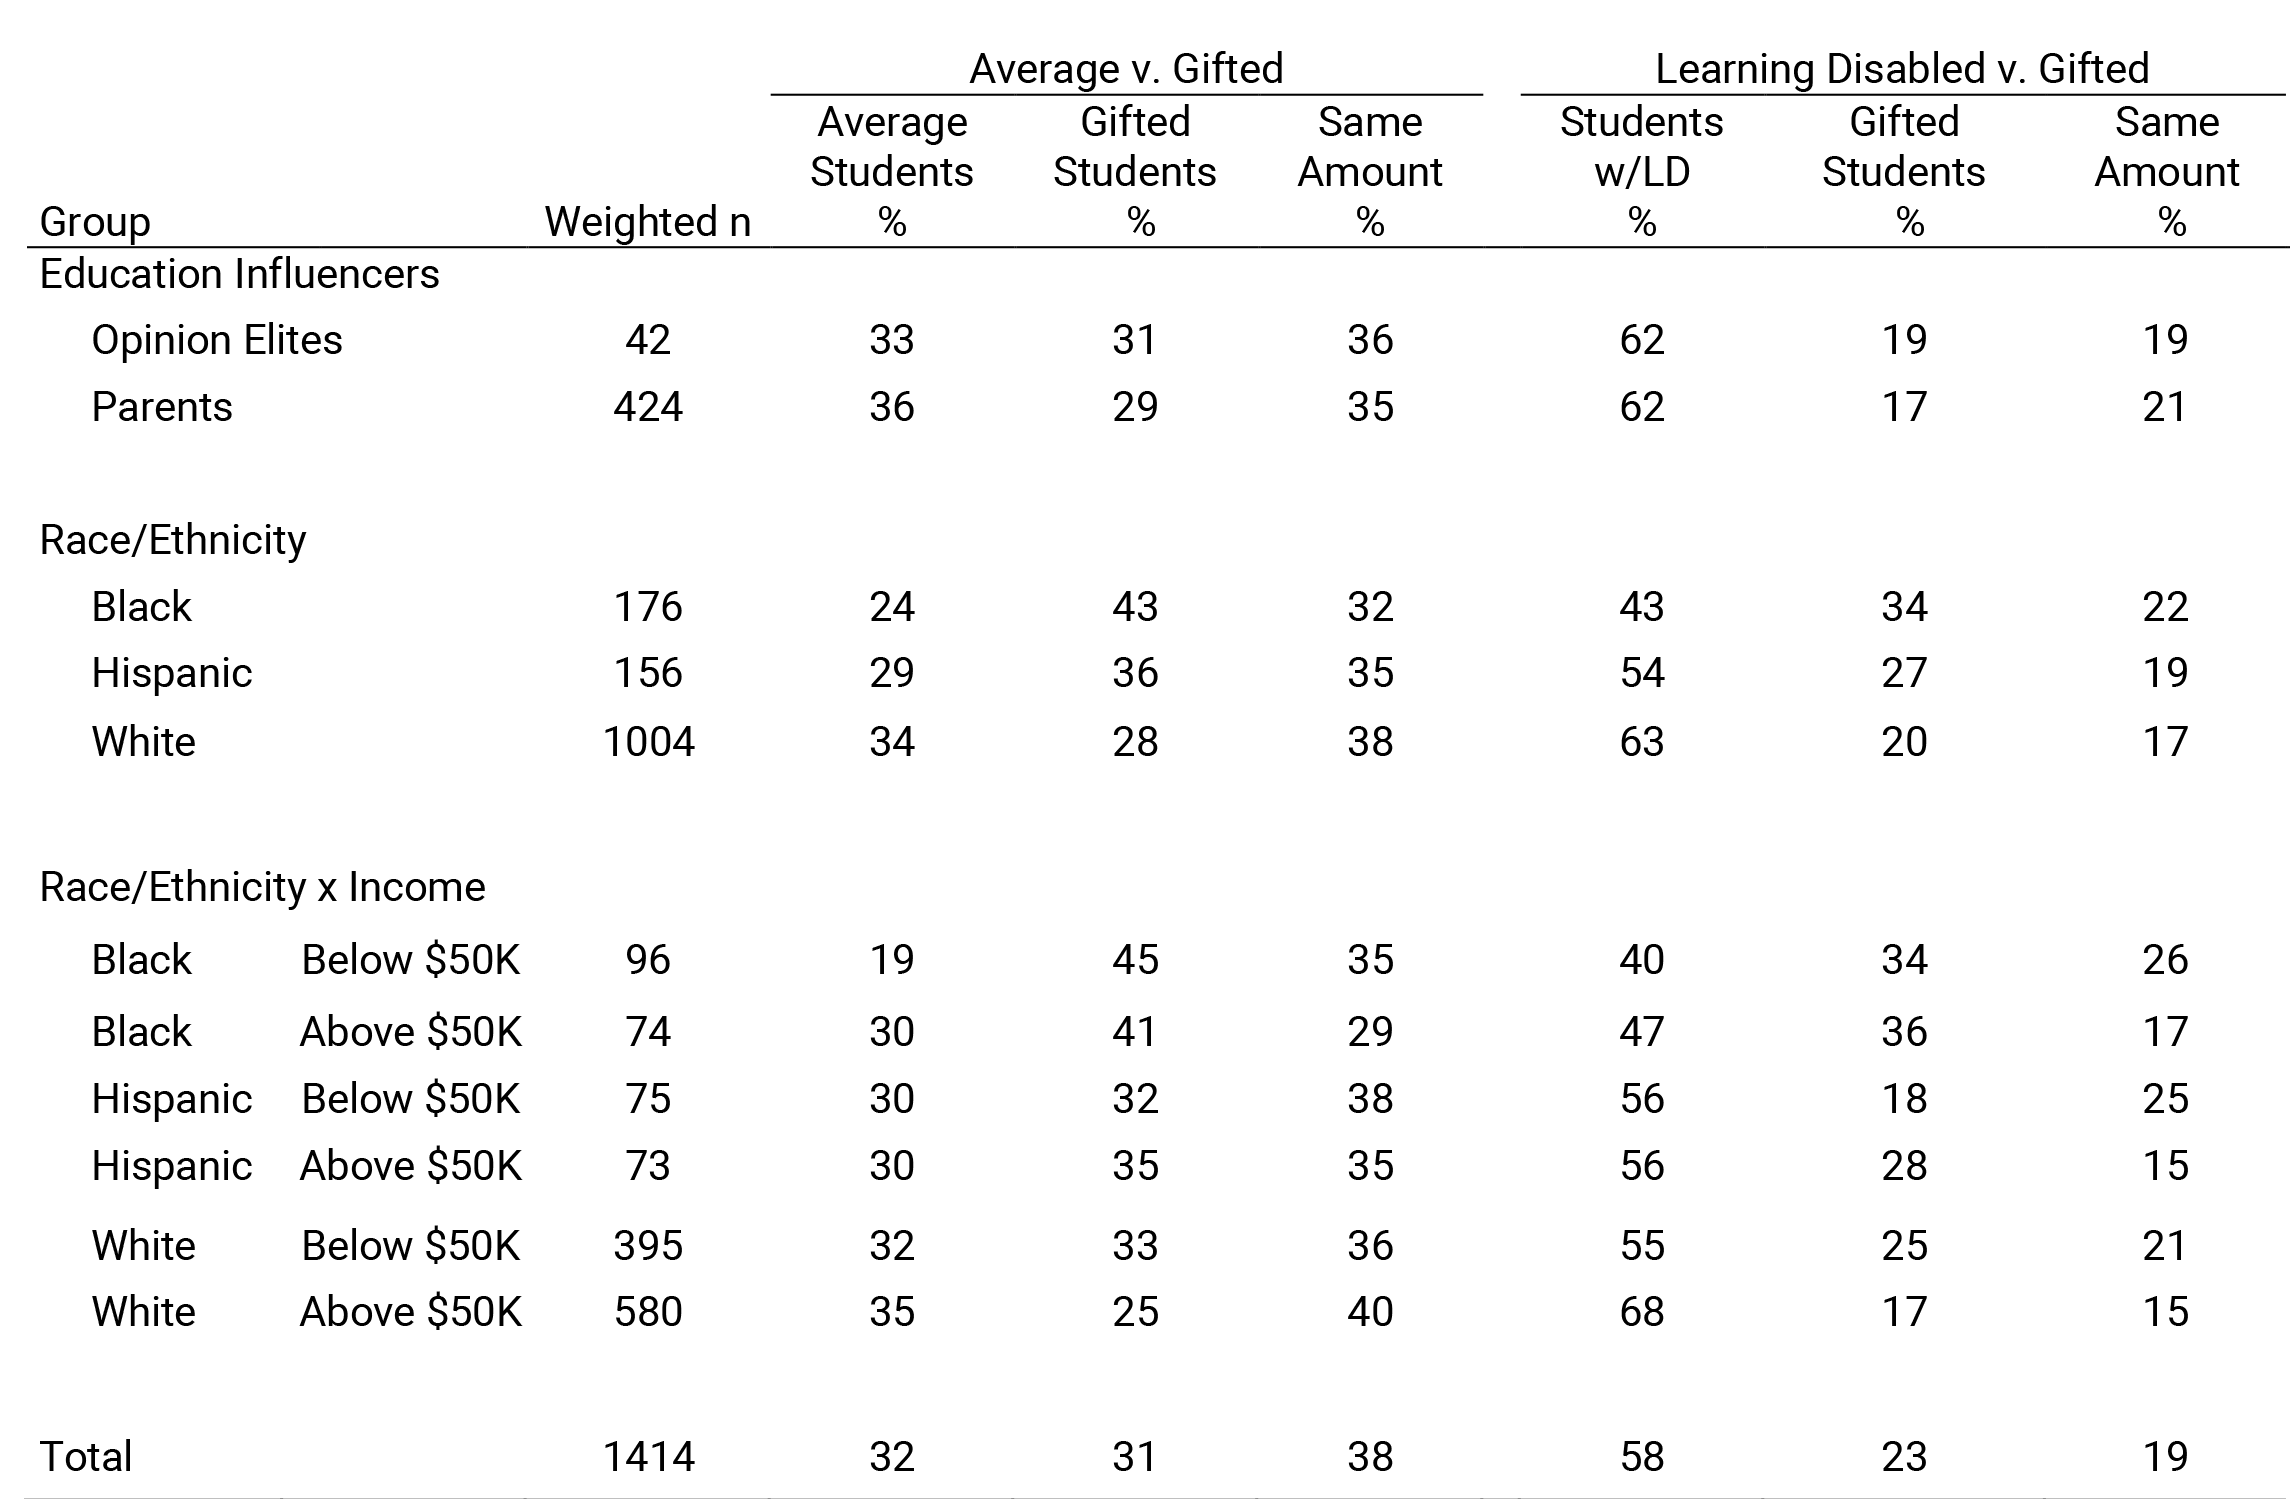
Notes. LD = learning disabilities. At the 95% confidence level the standard error of measure for the entire sample is ±2.51%. It is ±6.21% among Opinion Elites, ±3.73% among Parents, ±6.03% among Blacks, ±5.81% among Hispanics, and ±3.33 among Whites. Race/Ethnicity does not include respondents who selected more than one race. Race/Ethnicity x Income does not include respondents who selected “Prefer Not to Indicate.”
Synopsis
The Public’s Understanding of “Gifted” and Related Terms
A common understanding of terminology is the baseline for effective advocacy. Using language that the public intuitively understands is crucial to sending a clear message.
- Results from the IEA-P suggest that the public has a basic understanding of the word “Gifted” which is consistent with most experts in the field: gifted children have an intrinsic ability to learn quickly.
- The public distinguished between “Gifted” children and children with “High-Ability.” In the minds of the public, gifted children have an inherent ability to learn faster, while “High-Ability” children achieve through determination, persistence, and hard work. The public rarely used words associated with high IQ or quick learning when describing students with “High-Ability.” Advocates should avoid using the word “Gifted” and “High-Ability” interchangeably, because the public associates the two terms with different groups of students.
- The public rarely included creativity in their descriptions of giftedness or high ability. When words associated with creativity were invoked, they were in response to the terms “Gifted and Talented,” “Gifted,” and “Genius.”
- When asked to volunteer descriptions of gifted or high-ability children, the public rarely offered terms invoking common stereotypes suggestive of maladjustment. They also never mentioned personality attributes as an integral part of giftedness. Instead, they focused narrowly on attributes related to the capacity to learn.
- Of the terms tested in the IEA-P, “Gifted and Talented” and “Gifted” had the largest shared understanding between experts and the lay public.
Public Beliefs about Giftedness
The literal definition of a word is different from its cultural interpretation. Misconceptions about a group of people can lead to false assumptions about their needs. However, according to the responses in the IEA-P, the public does not subscribe to many of the so- called “myths” about gifted students.
- 76% of IEA-P respondents think that gifted children are rare, comprising a small proportion of the student population. It may be that in everyday conversation someone will say “all children are gifted,” meaning that all children have intrinsic value or something to contribute. However, when the question is presented in context, the public does not believe in the Lake Woebegone effect that “all children are above average.”
- The public believes that, though rare, gifted students come from all walks of life. 71% disagreed that gifted students are from well-off families, including over 70% of most analysis groups. Both in open-ended questions and in response to forced-choice items, the public made it clear that they believe gifted students live in neighborhoods in every corner of the country.
- The public understands that gifted students require special services to cultivate their abilities. 70% of the public believed that gifted students need special services, and the same number felt that gifted students should receive resources at the same level as students with learning disabilities. They held this attitude even though 55% also believed that gifted students are already at the top of their class. This result marks a shift in thinking from 40 years ago when providing services for students with learning differences had much more support than providing services for gifted students.
References
Duckworth, A. (2016). GRIT: The power of passion and perseverance. Toronto, Ontario, Canada: Harper Collins Publishers. Ltd.
Gallagher, J. J. (1988). Our love/hate affair with gifted children. Gifted Child Today, 11, 55-57.
Gallup, A. M. (1985). The 17 th annual Gallup Poll of the public’s attitudes towards the public schools. Phi Delta Kappan, 67, 35-47.
Gallup, A. M., & Elam, S. M. (1982). The 14 th annual Gallup Poll of the public’s attitudes towards the public schools. Phi Delta Kappan, 64, 37- 50.
Gallup, A. M., & Elam, S. M. (1988). The 20 th annual Gallup Poll of the public’s attitudes towards the public schools. Phi Delta Kappan, 70, 33- 46.
Gallup, G. H. (1980). The 12 th annual Gallup Poll of the public’s attitudes towards public schools. Phi Delta Kappan, 62, 33-46.
Grassley continues efforts to help gifted and talented students and educators (2005, March 2). Retrieved from https://www.grassley.senate. gov/news/news-releases/grassley-continues- efforts-help-gifted-and-talented-students-and-educators-1.
Larsen, M. D., Griffin, N. S., & Larsen, L. M. (1994). Public opinion regarding support for special programs for gifted children. Journal for the Education of the Gifted, 17, 131-142.
McCoach, D. B., & Siegle, D. (2007). What predicts teachers’ attitudes toward the gifted. Gifted Child Quarterly, 5, 246-255.
Renzulli, J. S. (1982). Myth: The gifted constitute 3–5% of the population (Dear Mr. and Mrs. Copernicus: We regret to inform you. . .). Gifted Child Quarterly, 26, 11-14.
Troxclair, D. A. (2013). Preservice teacher attitudes toward giftedness. Roeper Review, 35, 58-64.
Advocates should not use terms associated with “giftedness” interchangeably with terms related to “high-ability,” because the public believes they refer to different groups of students